Welcome to 2024.
If this year is anything like 2023, expect the unexpected. Last year proved just how hard it is for anyone, Wall Street included, to predict what the economy and the markets will do.
This time last year, just about everyone was calling for a recession, and so far, that call has been wrong. As I think about 2024, I think about current and historical trends, and as my clients will tell you, I love a good chart that can help tell part of the story.
This is the first part of a two-part blog, where I will share the top 10 charts that I think could tell part of the 2024 story, regardless of what’s to come. Today I present charts 10-5, let’s go!
#10 Wall Street Predictions for 2024
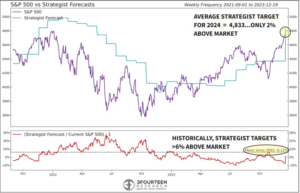
Wall Street was very bearish for 2023, and even though they were wrong, they aren’t that high on 2024 either. As this chart shows, the average Wall Street firm is predicting just a 2% gain for the S&P 500 for 2024 from where the market was in late December. You can also see in the bottom panel that historically, on average, they predict a 6% gain, so this year’s prognostications are very muted.
Why it might matter- 2023 proved Wall Street can get it wrong, but this lack of enthusiasm for stock market returns will act as a headwind because firms may be reluctant to allocate more money towards stocks.
#9 Cash on sidelines
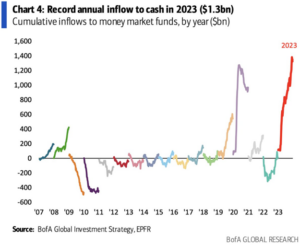
This chart almost looks too unrealistic to be true, as it shows the record inflow of cash to money markets over the last 15 plus years. 2023 was clearly a record and for good reason, as many of us are seeing money markets paying 4-5% interest for the first time in decades.
Why it might matter- The bond market has started to price in a series of rate cuts by the Federal Reserve in 2024, and the Fed, for its part, has not pushed back on that narrative. The timing of when these cuts might start, and the pace and size of the cuts has yet to be determined. However, the thesis is still as follows: if and when the Fed starts to cut rates, the yields on money markets will most likely fall as well. If that happens will this cash rotate back into stocks? If so, that could be a tremendous tailwind for the stock market.
#8 Mortgage Rates
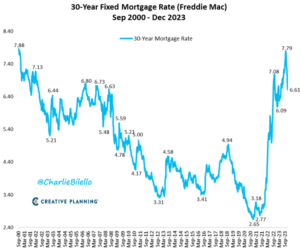
Almost 70% of the growth in the US economy comes from consumer spending, and housing is the single largest sub-category, almost twice as large as the second biggest, transportation. As the market starts to price in Fed rate cuts in 2024 and interest rates fall, the 30 year mortgage rate should come down with it, which should stimulate the US economy.
Why it might matter- I think this chart is the epicenter of the conundrum that the Federal Reserve finds itself in. If the Fed starts to cut in 2024, mortgage rates should continue to come down. If mortgage rates fall too fast and too quickly, does it unleash the animal spirits of home buyers? Are there a lot of millennials currently priced out of homes due to 6.5% mortgages, who, if they see rates dip into the 5% range, suddenly rush to buy a house? If that occurs, it could stoke inflation and, just as important, inflationary fears again. The Fed was late to raise rates to curtail inflation following COVID, will they be slow again if they see the housing market start to heat up?
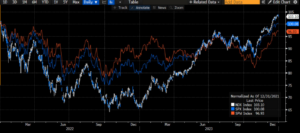
#7 2023 was good for stock returns, but since 2022 was so poor, what do returns look like over the last 2 years?
First let me explain the chart. NDX in white is the NASDAQ, SPX in blue is the S&P 500, and SPW in orange is the S&P 500 equal weight. The S&P 500 is a market cap weighted stock, so the bigger the company, the more impact its stock has on the day to day, week to week, month to month returns. The equal weight index was created to give all 500 companies in the S&P 500 the same stock price impact, it removes the size factor. The other thing this chart does, is set the starting date to 1/1/2022 and the index is based to 100. OK, so what does all this mean?
Why it might matter- Looking at stocks over a 2-year period we see they hardly went anywhere! Yes, the NASDAQ had a great 2023, but all it did was make back what it lost in 2022. If you held the NASDAQ for the last two years, you would have made about 3%…total. The S&P 500? You’re basically right back where you started, with them just a hair higher. And the equal-weight index is actually down. So, in essence 2023’s returns were just about making back what was lost in 2022.
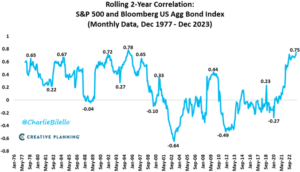
#6 Correlations have hit 30-year highs
This chart shows the correlation between price moves in the S&P 500 and the US Aggregate Bond market. As you can see, for much of the last 20 years, stocks and bonds were negatively correlated. This means (in English), if stock prices went down, bond prices would go up, and vice versa. As we all know the stock market can be volatile, so in an attempt to mute some of that volatility and to diversify the risk in a portfolio, bonds can be added. After all, if bonds and stocks are negatively correlated, bonds should go up if the stock market starts to slide.
Why it might matter- As we can see in the chart, stocks and bonds are now positively correlated and in fact they have reached the highest level of correlation in almost 30 years. This trend may break in 2024, especially if there is a recession. Typically, when a recession occurs, stocks will fall, and people will rush into bonds, driving their prices up. The correlation could also break if there’s a soft landing, but inflationary fears persist. Regardless of what causes the correlation to come down, for most investors it would be a positive development because it would mean diversification benefits should return to their portfolios.
Next week I’ll review charts #5 through #1 and summarize, so stay tuned!
Derek Amey serves as Managing Partner and Co-CIO at StrategicPoint Investment Advisors in Providence and East Greenwich. You can e-mail him at damey@strategicpoint.com.
The information contained in this post is not intended as investment, tax or legal advice. StrategicPoint Investment Advisors assumes no responsibility for any action or inaction resulting from the contents herein. Derek’s opinions and comments expressed on this site are his own and may not accurately reflect those of the firm. Third party content does not reflect the view of the firm and is not reviewed for completeness or accuracy. It is provided for ease of reference.
Certain statements contained herein may be statements of future expectations and other forward-looking statements that are based on SPIA’s current views and assumptions and involve known and unknown risks and uncertainties that could cause actual results, performance or events to differ materially from those expressed or implied in such statements. In addition to statements which are forward-looking by reason of context, the words “may, will, should, expects, plans, intends, anticipates, believes, estimates, predicts, potential, or continue” and similar expressions identify forward-looking statements. Forward-looking statements necessarily involve risks and uncertainties, and undue reliance should not be placed on them. There can be no assurance that forward-looking statements will prove to be accurate, and actual results and future events could differ materially from those anticipated in such statements. SPIA assumes no obligation to update any forward-looking information contained herein.

