The past week has been a stark reminder on why being an investor can be so hard.
In the last week the S&P is down over 5% and the Dow has slid almost 2,000 points.
It’s important to remember that sell-offs like this are not a bug, but a feature. Since 1957, the S&P 500 has had an annual return of just over 10%. However, to earn those higher returns one must pay the price of admission in the form of volatility and the occasional correction.
With that in mind, I composed a list of 5 thoughts on the recent action in the markets:
1) “Bulls take the stairs; bears ride the elevator.”
The quote above is a very famous Wall Street saying, and so far in 2024, we’ve seen the market follow this to a T.
Since April, the stock market has just been grinding higher, day after day and week after week. During that time, we’ve hardly seen any days with big moves, up or down. It feels like investors ignored every bit of bad news thrown at them and got lulled into a false sense of security. However, history has shown that all it takes is a change of sentiment, real or perceived, and people can quickly panic and sell, as history has shown it does quite often.
2) So far, this sell-off has been within the historical norms.
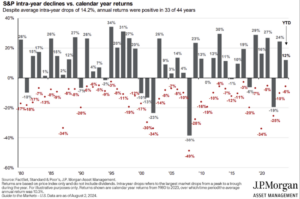
Many of you have probably already seen this chart, but it’s worth sharing again. The grey bars below represent what the stock market did in any year, going all the way back to 1980. The red dots, however, show how large of a drop the market had that same year.
For example, everyone remembers the sharp sell-off in 2020 of over 30% when COVID first hit, even though by year-end, stocks returned over 15%. As JP Morgan shares under the header, over the last 44 years the average drop in the S&P is 14%+.
As of my writing this on Monday night, the S&P is not even down 10% yet. It may feel really bad, but as the chart shows, we’ve all lived through much worse in recent years, and yet the market was hitting all-time highs just a few weeks ago!

3) If you read the headlines or watch the news, there’s always a reason to be worried.
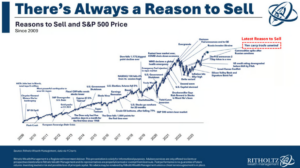
Another great chart: this one annotating the S&P 500 over the last 15 years, with current events at the time when there was a market correction of size. The last 15 years have been littered with news items that, at the time, sounded bad for the economy and the markets. Look at just some of the events:
• The “S&P downgrades US debt” in 2011
• US Government shut down in 2013
• The Presidential election in 2018
• Brexit
• Dow had its largest one day decline in history back in 2018
Look for yourself, and you’ll see the list goes on and on, and how when we look back now many of those events…turned out to be noise. Sorting the news from the noise is hard, and sometimes it’s only with the benefit of hindsight that our fears at the time seem irrational.

4) Diversification is working, again.
One of the common investment themes following the Great Financial Crisis in 2008 was that when the stock market started to wobble, money would flow out of stocks and into bonds. The industry has a term for this, which is “negative correlation” which is when you have assets that move in opposite directions to each other.
As the Fed started to raise rates these past few years, suddenly that negative correlation between stocks and bonds flipped to a positive relationship. Both were moving up or down in unison, and the diversification benefits that bonds produced the previous decade were suddenly disappearing.
However, in the last month we’ve seen the relationship flip again. As the stock market has started to slide, bonds have rallied. Those investors who didn’t give up on bonds, even when the correlation to stocks looked positive, have been rewarded so far during this correction.
5) Some of this is the Japanese Yen’s fault.
This is going to get a little nerdy, but on July 31st, the Central Bank of Japan raised its interest rates by 0.25%, which was a surprise because most folks expected them not to rise, or only go up by 0.10%, so the larger move caught people off guard.
The news has recently spoken about a phenomenon called the “yen carry trade” and how some of this sell-off has been because that carry trade is reversing. Allow me to try and explain.
The yen carry trade is a fancy way of saying some investors were borrowing Yen at really low interest rates, taking those proceeds of Yen, converting them into dollars where they can earn 4-5% from money markets or bonds, or they may invest some of those proceeds into the US stock market.
It’s not a perfect analogy but imagine if you took cash out from a home equity loan at record-low interest rates, converted those dollars you borrowed into British Pounds, and then bought British stocks with it.
You can make money two ways in this rudimentary example. The first is if the stocks you invested in went up, and the second way is if the dollar fell against the British pound. That is sort of what was happening with the “yen carry trade”, as the yen dropped to almost 40-year lows against the dollar earlier this year.
When Japan raised rates in a surprise move a week ago, the trade suddenly cost more than it had been and it appears in order to satisfy their loans in Yen, money had to be raised. So going back to my example, imagine the rate on your home equity loan jumps, the logical response would be to sell British stocks, get British pounds, convert them to dollars, and pay the loan off.
Well, when this trade is being done by professional investors, and many of them doing the same trade in extremely large sizes, the jump in rates spooked them and they all ran to unwind the trade.
For sure, unwinding this trade has exacerbated some of the selloff.
Conclusion
It’s important during times like this when the market goes haywire, to look at the bigger picture. Most of us are investing for the long term, and when we look back at this week in 5 or 10 years, it most likely will look like just another hiccup in the market, within its long-term upward trend, like many of those other events on that chart look like.
It’s totally normal to wonder what’s happening, especially after a prolonged period of relatively calm markets. But it’s important to remember that even with this sudden correction, the S&P 500 is back to the same level it was way back…in early May!
Imagine someone walking their dog along a path in the park. Typically, the person will casually stroll along the path, with a slow steady measured pace. Whereas the dog might be running all over the place, tugging on the leash, occasionally stopping, or even running back the way he came. Eventually, though, they will both arrive at the end of the path together. The person walking the dog is the economy, and the dog is the stock market.
We don’t currently see a recession on the horizon but admit that economic growth has slowed. The most severe stock market corrections in modern times have usually coincided with a recession, which is why investors spend so much time trying to determine if one is coming. Many of the early recession indicators used in the past have not worked post-COVID, so be wary of anyone screaming that they know one’s coming. Just try to picture yourself as the person walking the dog, calmly and with a purpose, the dog will catch up to you at some point!
Derek Amey serves as Managing Partner and CIO at StrategicPoint Investment Advisors in Providence and East Greenwich. You can e-mail him at damey@strategicpoint.com.
The information contained in this post is not intended as investment, tax or legal advice. StrategicPoint Investment Advisors assumes no responsibility for any action or inaction resulting from the contents herein. Derek’s opinions and comments expressed on this site are his own and may not accurately reflect those of the firm. Third party content does not reflect the view of the firm and is not reviewed for completeness or accuracy. It is provided for ease of reference.
Certain statements contained herein may be statements of future expectations and other forward-looking statements that are based on SPIA’s current views and assumptions and involve known and unknown risks and uncertainties that could cause actual results, performance or events to differ materially from those expressed or implied in such statements. In addition to statements which are forward-looking by reason of context, the words “may, will, should, expects, plans, intends, anticipates, believes, estimates, predicts, potential, or continue” and similar expressions identify forward-looking statements. Forward-looking statements necessarily involve risks and uncertainties, and undue reliance should not be placed on them. There can be no assurance that forward-looking statements will prove to be accurate, and actual results and future events could differ materially from those anticipated in such statements. SPIA assumes no obligation to update any forward-looking information contained herein.
