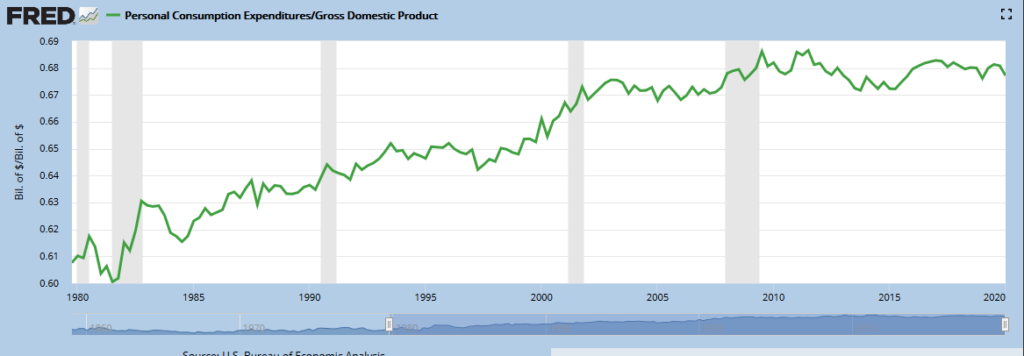
You will often hear, “so goes the consumer, so goes the United States economy.” This is a phenomenon that has grown during my lifetime, as we shifted away from a manufacturing economy to a more service-based economy. Look below at the chart and you will see that consumer spending does make up almost 70% of US GDP and has for quite some time. (“Personal consumption expenditures” is Fed speak for Consumer spending, so dividing that into GDP gets you the ratio.) As states start to reopen, and business start to wonder if their clients will come back, we thought we should look at some stats on the state of the American consumer.

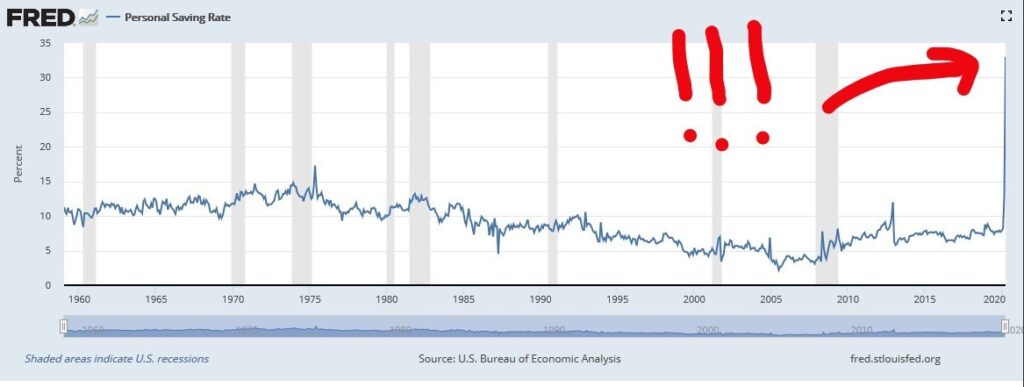
For the rest of my career, some of these economic charts are going to almost look unbelievable, people will wonder if there is a mistake in the data. For example, look below at the savings rate of Americans. They started tracking this rate back in the ‘60’s and in no other time period, not even during previous recessions, was it nearly as high as it is now. The single biggest reason that the rate spiked to 33% is the inability of people to spend money, even if they want to right now, due to the lock downs.
Interestingly, the savings rate was on a secular decline starting in the 80’s that continued until the 2008 recession. Then we can see that the savings rate did appear to be trending higher since 2008, and one wonders if that trend will accelerate. Unfortunately, if too many Americans do the prudent thing and save a little more, the net result would be lower US economic growth since that would mean lower consumer spending.

Besides supermarkets and Amazon, where are people spending right now?
I am usually one to loathe anecdotal stories, but a recent one sparked part of my research for this blog. My wife is friendly with some folks who work at a local store that sells kayaks. She recently asked them how business was and the response she received was “If we had more inventory, we could sell more. We can’t keep any in stock!” As the weather has started to warm up, and as states open with certain social distancing rules, many of us are looking to get outdoors. And getting outdoors means getting new toys to enjoy! Look at some recent headlines we have seen:
Want to buy a pool? Probably too late for this summer: https://www.nytimes.com/2020/06/03/nyregion/coronavirus-above-ground-pools.html
Maybe you want some new golf clubs? Expect delays! https://www.forbes.com/sites/erikmatuszewski/2020/06/14/amid-pandemic-ben-hogan-golf-equipment-company-had-record-setting-sales-in-may/#56fa4442198d
Want to buy a bicycle? Be prepared to wait:
https://www.nytimes.com/2020/05/18/nyregion/bike-shortage-coronavirus.html
RV Sales?
https://qz.com/1868462/more-americans-may-be-driving-rvs-this-summer/
Some of these purchases, especially RV’s and boats, are significantly large. Rational folks would not be committing to these large purchases unless they felt confident about their jobs and their income. These purchases reflect that many Americans are still feeling optimistic about their future financially. Look for the savings rate to return to normal, if these types of articles continue to roll in.
What about homes?
Speaking of large purchases, home sales are the single largest purchase many of us will ever make so we must pay attention to the health of the real estate market to get a sense of how consumers are acting. The government will release May sales data next week, but understandably April sales data did show a drop. Here is a chart of existing home sales: (Existing home sales make up about 90% of all homes sold)

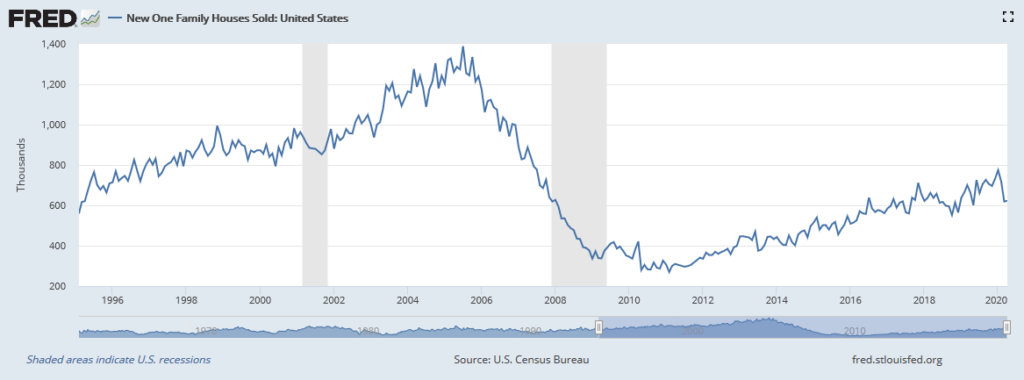
The drop in new home sales was not as pronounced, as you can see in the chart below. However, there may be a lag in this data, due to the steps a homebuyer must go through to buy a new home. It is a longer process from start to finish, as opposed to buying an existing home, so we do expect this data to potentially worsen in the next release.

Even though we do not have the latest housing sales data yet, we are hearing from companies in the real estate space that right now demand is very strong. Mortgage applications are 21% higher today than a year ago, according to the Mortgage Bankers Association. They also reported that it was the ninth straight week of gains, and the highest volume in 11 years! Record low mortgage rates have helped entice buyers. Last week a traditional 30-year mortgage was about 3.2%. By comparison, the record high rate was in 1981, when a 30-year mortgage was about 16.6%!
One area of concern with housing is that some sellers are reluctant to let strangers into their homes. New listings of homes for sale are down year-over-year, (see chart below) even with demand for homes stronger over the same time period. Reports of bidding wars are building across the country, as buyers find that inventories of desirable homes are extremely low. This is good news if you are selling, but not great if you are in the market to buy.

Retail sales update
May retail sales were released on Tuesday morning, and blew away estimates. Analysts had predicted that retail sales would increase, month-over-month by 8%. Instead the Commerce Department released data that showed retail sales jumped 17%.

Obviously, the total sales figure still has a long way to go to get back to pre-COVID levels, but the strong rate of change is making people reassess what shape the recovery could look like. Be sure to read Betsey Purinton’s blog on this topic from a few weeks ago if you haven’t already.
OK, sales bounced back but where is the money coming from?
As sales spike, we need to be cognizant of how people are paying for things. The recent data from credit card company does paint an interesting picture. In the first chart the red line represents credit card debt, and we can see where people are clearly paying their debt down quite dramatically. Again, as people are stuck at home an unable to spend perhaps this is where some of the stimulus checks went.

However, there is also a growing group of people who are struggling to make ends meet. The chart below shows the percentage of credit cards that are 30 days delinquent. The sudden spike is troublesome, but to be expected as some Americans are focusing on paying for necessities. As states reopen and people go back to work we’d hope to see this trend reverse.

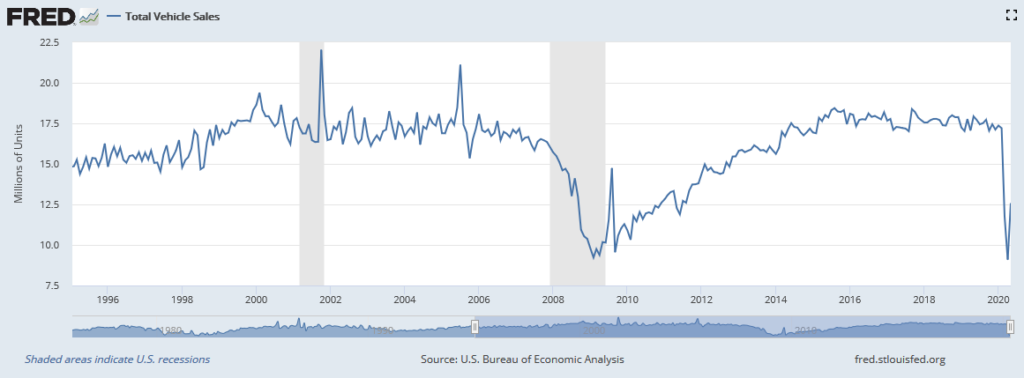
Auto sales are a big component in the retail sales data, and much like a home purchase of this dollar size, speaks to the confidence the buyer has in their personal financial situation. Total sales dropped precipitously as the economy shut down, but we have seen the number bounce back, as shown below:

Again, we see a V-shaped bounce back from the lows in auto sales. If you are in the market for a new car, now is one of the best times to go as the deals they are offering are almost unheard of. We’ve seen offers where a person can drive away today with a new car, make no payments for 6 months, and then finance the car at 0% for 72 months after that. If sales continue to climb, dealers will start to realize they may not need to offer such crazy deals to entice people to buy. On the other hand, if these deals do continue to persist, it may speak volumes.
Summary
It should be clear by now that the data shows that there are a fair number of Americans who are ready, willing and able to spend beyond necessities. However, we are by no means back to pre-COVID levels and time will only tell if that happens. To reach anywhere close to pre-COVID levels of consumer spending, we must see the unemployment number continue to fall. We also must watch the data very closely as the government assistance programs end. It’s impossible to know how much consumer spending is being supported by the increased unemployment benefit. Those extra unemployment benefits are set to end on July 31st. Right now, the chance that program is extended seems low, so we will have to wait and see if consumer spending slows as Americans realize their increased benefit is ending. We will also see some of the mortgage forbearance programs start to end in the coming months. It is estimated that over 7% of people with a mortgage have asked to delay their mortgage payments. Again, as these programs start to end, do we see the spending numbers sag? We will just have to wait and analyze the data as it comes in but it’s clear that right now Americans, after being cooped up for weeks on end are looking to get out and enjoy life and spend some of their hard earned income.
Derek Amey serves as Partner and Portfolio Manager at StrategicPoint Investment Advisors in Providence and East Greenwich. You can e-mail him at damey@strategicpoint.com.
The information contained in this post is not intended as investment, tax or legal advice. StrategicPoint Investment Advisors assumes no responsibility for any action or inaction resulting from the contents herein. Derek’s opinions and comments expressed on this site are his own and may not accurately reflect those of the firm. Third party content does not reflect the view of the firm and is not reviewed for completeness or accuracy. It is provided for ease of reference. Certain statements contained herein may be statements of future expectations and other forward-looking statements that are based on SPIA’s current views and assumptions and involve known and unknown risks and uncertainties that could cause actual results, performance or events to differ materially from those expressed or implied in such statements. In addition to statements which are forward-looking by reason of context, the words “may, will, should, expects, plans, intends, anticipates, believes, estimates, predicts, potential, or continue” and similar expressions identify forward-looking statements. Forward-looking statements necessarily involve risks and uncertainties, and undue reliance should not be placed on them. There can be no assurance that forward-looking statements will prove to be accurate, and actual results and future events could differ materially from those anticipated in such statements. SPIA assumes no obligation to update any forward-looking information contained herein.
