If you’ve listened to any of the Novice and The Nerd podcasts this summer you’ve probably heard about Laura’s trials and tribulations with buying a “new” used car. In the end, she did finally purchase a car, but not until her dad and her mechanic gave the car a thorough inspection. Just because the car looks ok, doesn’t mean there’s not something lurking underneath. Listening to Laura tell stories about this painful process for her and how looking under the hood on used cars tells a different story than the condition of the body of the car made me think about stock market returns in 2023. We are seeing nice year-to-date returns of the S&P (as of Sept 21st the S&P is up over 14% year-to-date) but when you lift open the hood those returns are masking some issues underneath.
Let’s take a look underneath the hood at what’s going on in the stock market this year, shall we?
(Please note, charts of year-to-date performances are taken from Google and are as of the close of September 22nd)
S&P 500 definition revisited
As a reminder, the S&P 500 is a market-cap weighted index, which is to say the larger the company is, the more its stock price return influences the overall index’s return. So, to state the obvious, the bigger the company, the bigger the impact on the index… the smaller the company, the smaller the impact.
For example, Apple and Microsoft are currently both worth over $2 Trillion a piece, whereas a local company like TJ Maxx is roughly $100 billion, CVS is $90 Billion and Hasbro is just $9 billion.
Due to their immense size, Apple and Microsoft currently represent over 13% of the S&P 500, so on any given day, the returns of one of those stocks can heavily influence the total S&P 500. On the other hand, due to their relatively small size, TJX, CVS and Hasbro’s daily stock fluctuations barely impact the overall index at all. Even if one of those three companies’ stock doubled in one day, their impact on the S&P 500 would still be negligible. This is a key point to remember as we delve into 2023.
Small-Cap Returns Year-to-date
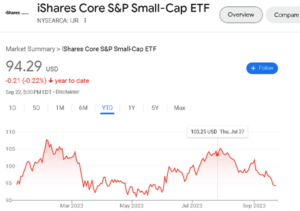
If the S&P 500 is doing so well, and people are buying stocks because they feel good about the future of the US economy, one would assume smaller cap stocks should also be doing very well. Small-cap stocks tend to be higher risk/reward stocks, and historically they can outperform large cap stocks when the economy is growing quickly (coming out of a recession, for example). Let’s look at the year-to-date performance of small-cap stocks:
Using the exchange-traded-fund, ticker IJR (Ishares Core S&P Small Cap stocks) as a proxy for small cap stocks, we can see that they are basically flat on the year, and they are lagging the S&P 500 returns by quite a large margin. Using historical analogs, with the S&P 500 experiencing double-digit gains, a safe assumption would have been that small cap stocks were having a good year also, however that is clearly not the case. Let’s look at small-cap stocks’ older brother, the Mid-Cap space.
Mid-Cap year-to-date returns
Mid-cap stocks tend to be overlooked as an asset class vs their large cap and small-cap brethren. They just don’t tend to get the attention the others get, so they are sort of a forgotten middle child. However, over longer time periods, mid-cap stocks tend to outperform both large and small cap stocks. Part of the reason for this outperformance over long periods is because some of these companies end up growing very quickly and ultimately become large cap stocks.
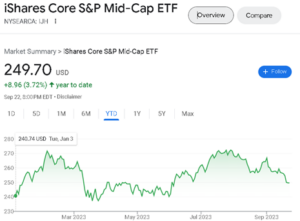
So, let’s look and see how they are performing this year:
Using the ETF ticker IJH (Ishares Core S&P Mid-Cap) as a proxy, we can see that mid-cap stocks are up over 3 percent, which is certainly more than small-caps, but still very much lagging the S&P 500. If animal spirits were running wild, and investors thought this was a new bull market and the US economy was on fire, one would have assumed that the mid-caps would be at a minimum keeping up with the S&P 500.
Equal Weight S&P 500
As we already discussed, with the S&P 500 being a market cap weighted index, the index returns are heavily influenced by the largest stocks in the US market.
There is some research that shows that over long periods of time using an equal-weighted approach to stocks would make more sense than market cap weighted. Part of the reason that equal weight can work better, is that it’s very difficult for the largest companies to stay as the largest.
In an equal weight S&P 500 index, the impact of the stock returns of TJX, CVS or Hasbro is now identical to Apple, Microsoft, etc. The playing field has been leveled, so that all 500 stocks have same impact on the returns of the index.
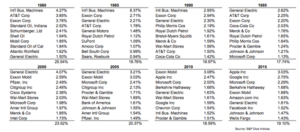
There’s an argument to be made that this approach of equaling all 500 companies would be a better indicator of the health of the US stock market, because it removes the heavily weighted influence of a small number of companies. We can see this trend play out over history, let’s look at this chart below that shows the top 10 companies over the past 40 years:
The turnover every few years is just amazing (and proof that capitalism does work). Looking at the top 10 in 1980, SEVEN of the top 10 were oil stocks! I have an extremely hard time believing an oil company will ever be in the top 10 again in my life, never mind seven of them. In full disclosure, I had to google Atlantic Richfield because I’d never even heard of it.
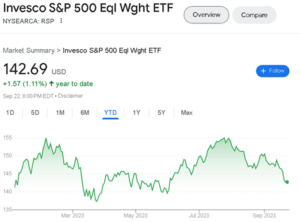
So, from a mathematical standpoint, if there’s that much turnover at the top it means that the larger stocks are suffering return-wise and the smaller ones are doing better, which allows them to creep into the top 10. Wall Street has created an ETF to track an equal-weight S&P 500 to allow investors to play this thesis…let’s check to see how it’s doing year-to-date:
That’s paltry, but what does it mean? It means that the average stock has not moved in 2023, AND more importantly, the reason the S&P 500 index we all watch is up so much is because of a handful of huge returns from the largest stocks!
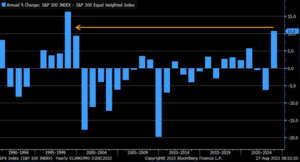
Leadership in just a handful of stocks is not new, it certainly has occurred before, but it’s been a while. Here we see a chart from late August that compares the spread between the S&P 500 return and the equal weight index over the last 30+ years.
We have to go all the way back to the late 90’s to find a time when the S&P was beating the equal weight index by such a wide margin:
So what stocks are causing this rather large historical difference?
Magnificent 7 defined
Wall Street loves to create cute nicknames for trends in the market. For example, maybe you remember the buzzword “BRICS”, which was super popular in the early 2000’s. The term was coined to lump Brazil, Russia, India, China and South Africa stock markets together as their economies and stock prices were seen as the darlings of Wall Street.
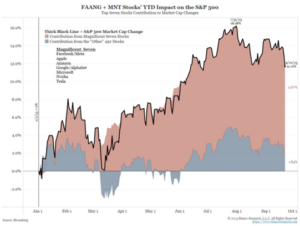
This year it’s the “Magnificent Seven” or MAG7 for short. Wall Street has now lumped the following companies together to make the MAG7: Meta, Amazon, Apple, Microsoft, Google, Tesla and Nvidia. The MAG7 currently represents over 25% of the weight of the S&P 500, which isn’t necessarily a good or bad thing, just the reality of 2023. It’s these 7 stocks that are literally dragging the S&P 500 higher this year. This chart is from the September 21st close, and shows that almost 85% of the S&P 500 returns so far in 2023 are from this handful of stocks:
The Bottom Line
It should be clear to you by now that these 7 stocks are masking a rather boring year for the stock market. Take these 7 stocks out of the picture and the reality is most US stocks have basically done nothing all year. We probably shouldn’t be surprised by this fact, since as we came into 2023 most folks on Wall Street thought the US economy would be in a recession by now. It certainly seems like investors are “hiding” out in these handful of names, waiting for the recession to begin. Ultimately, the challenge for investors in 2023 is that if you don’t have a healthy allocation to these 7 stocks, you’re basically spinning your wheels.
Derek Amey serves as Managing Partner and Co-CIO at StrategicPoint Investment Advisors in Providence and East Greenwich. You can e-mail him at damey@strategicpoint.com.
The information contained in this post is not intended as investment, tax or legal advice. StrategicPoint Investment Advisors assumes no responsibility for any action or inaction resulting from the contents herein. Derek’s opinions and comments expressed on this site are his own and may not accurately reflect those of the firm. Third party content does not reflect the view of the firm and is not reviewed for completeness or accuracy. It is provided for ease of reference.
Certain statements contained herein may be statements of future expectations and other forward-looking statements that are based on SPIA’s current views and assumptions and involve known and unknown risks and uncertainties that could cause actual results, performance or events to differ materially from those expressed or implied in such statements. In addition to statements which are forward-looking by reason of context, the words “may, will, should, expects, plans, intends, anticipates, believes, estimates, predicts, potential, or continue” and similar expressions identify forward-looking statements. Forward-looking statements necessarily involve risks and uncertainties, and undue reliance should not be placed on them. There can be no assurance that forward-looking statements will prove to be accurate, and actual results and future events could differ materially from those anticipated in such statements. SPIA assumes no obligation to update any forward-looking information contained herein.

