Following yesterday’s sell off we wanted to share some thoughts and facts about the economy and the market.
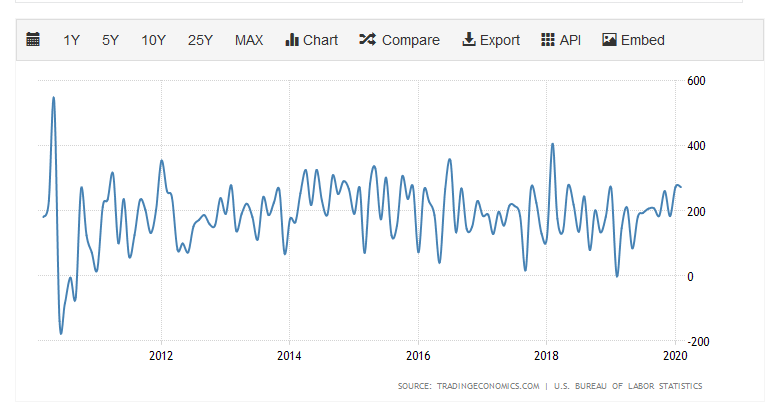
Lost in a new cycle filled with bad news, last Friday’s payroll report was the 113th month in a row with positive job growth here in the US. (The next closest record time period is 48 months!) While the next few months could be extremely challenging for the economy, it has been an amazing period of growth.
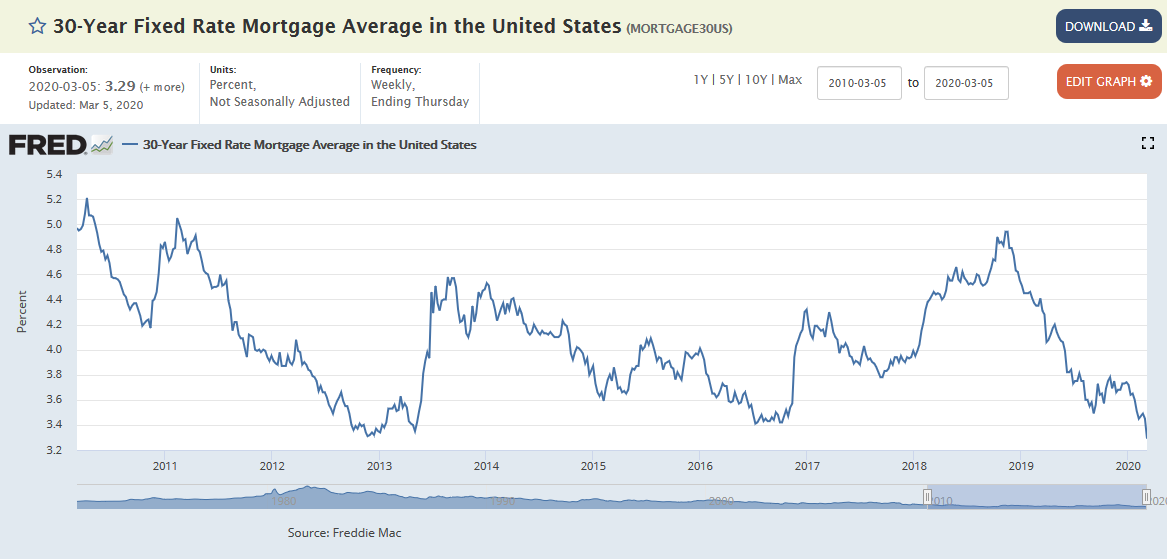
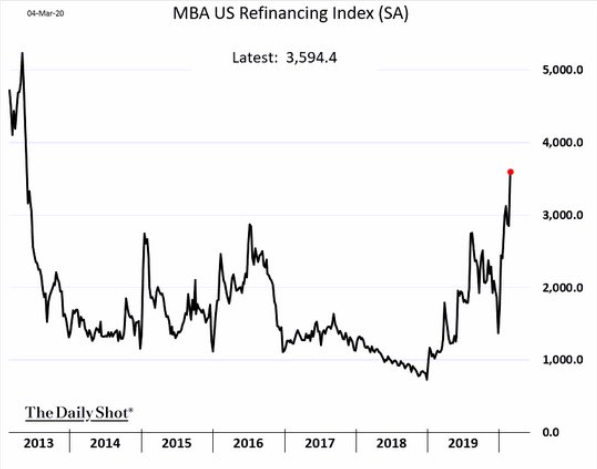
With the decline in interest rates, mortgage rates have fallen to extreme lows with a 30-year mortgage rate currently around 3.29%. Anecdotally we’re hearing a lot of people telling us they have started the process of refinancing. Ultimately the savings they get from this process will be a huge boost to the average consumer.
This chart is a few days old but shows you the amount of refinancing activity as of late.
Part of the reason that the market is going to have a rough start to the week is due the oil/energy market. Demand for oil has already been impacted globally due to the coronavirus. Many had assumed that OPEC, in an effort to create a floor on the price of oil, would respond by cutting production in response to lower demand. Russia, however, refused to agree to production cuts, which in turn caused Saudi Arabia to retaliate by announcing their intention to INCREASE production. Thus, an oil price war has begun.
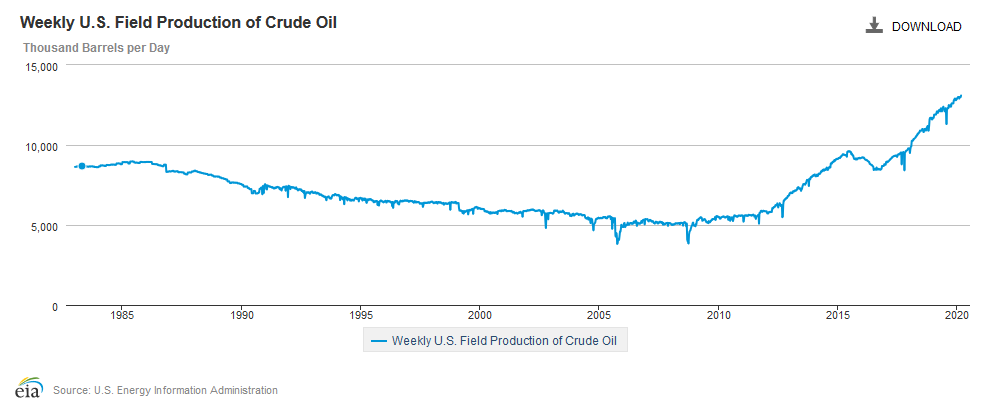
With US oil production at an all-time high, it will be improbable for those sectors of the US economy to avoid the negative economic impact if a barrel of oil hits $20 as some expect. Much like lower mortgage rates, lower prices at the pump will boost consumers ability to spend elsewhere.
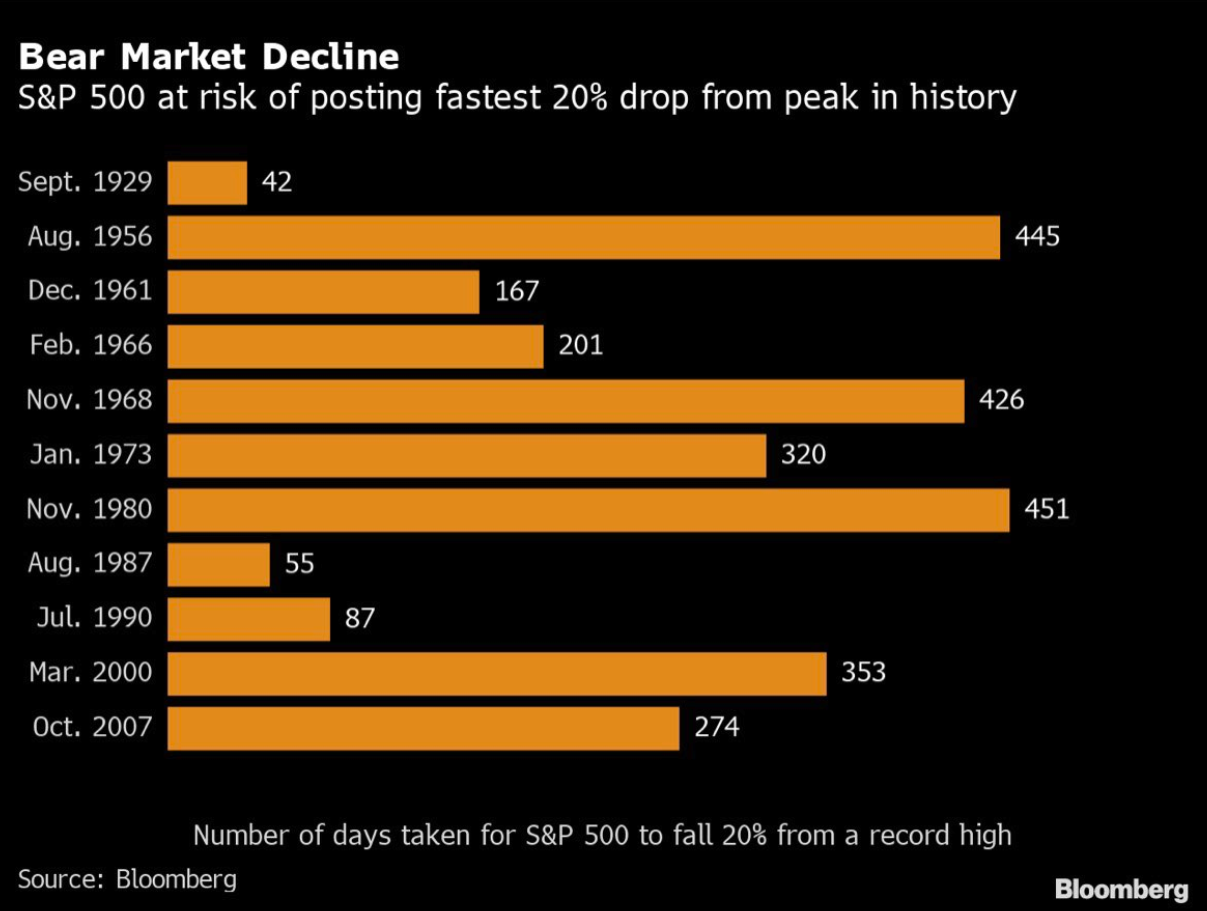
It may seem illogical, but not even 3 weeks ago, the S&P 500 was at all-time highs. We’re firm believers that “this too shall pass” but admit the speed of this correction is almost a record. Below is a chart of the number of days for the stock market to fall 20% from the record highs at that time.
As of the writing of this piece, the S&P has yet to reach a 20% decline. However, if the S&P was to hit a level of 2,708 prior to April 1st, it would set the record for number of days to drop 20% from the high.
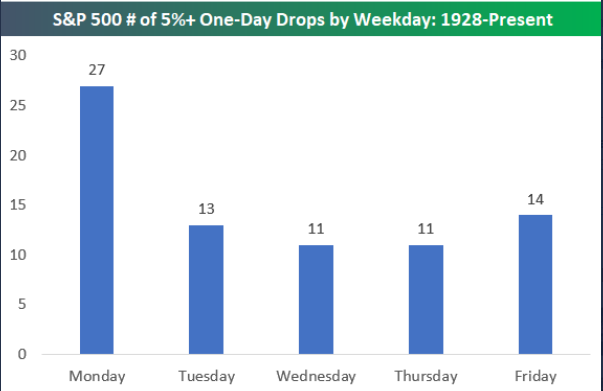
Mondays do hold the record by quite a large margin for historically bad days. You can see below that since 1928, a 5% drop has occurred on a Monday 27 times compared to a Friday (in second place at 14 times).
Source: Bespoke Investments
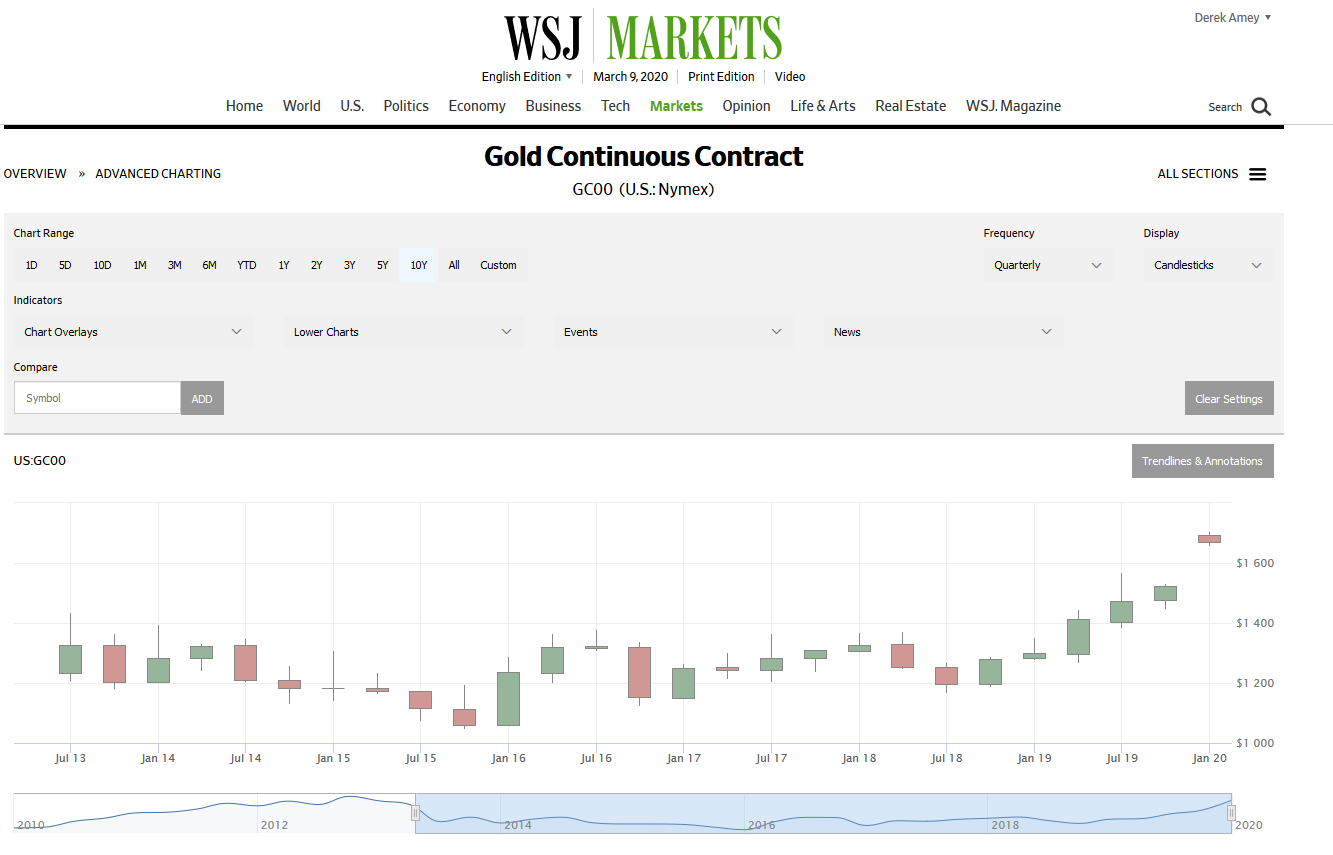
While stock prices are dropping, the price of gold is currently hitting 7-year highs. During the Bitcoin mania of 2017, there was some belief then that Bitcoin would be used as a store of value during the next crisis. So far that has failed to occur, as Bitcoin is down over 20% in the last few weeks. Here’s a current chart of price of gold:
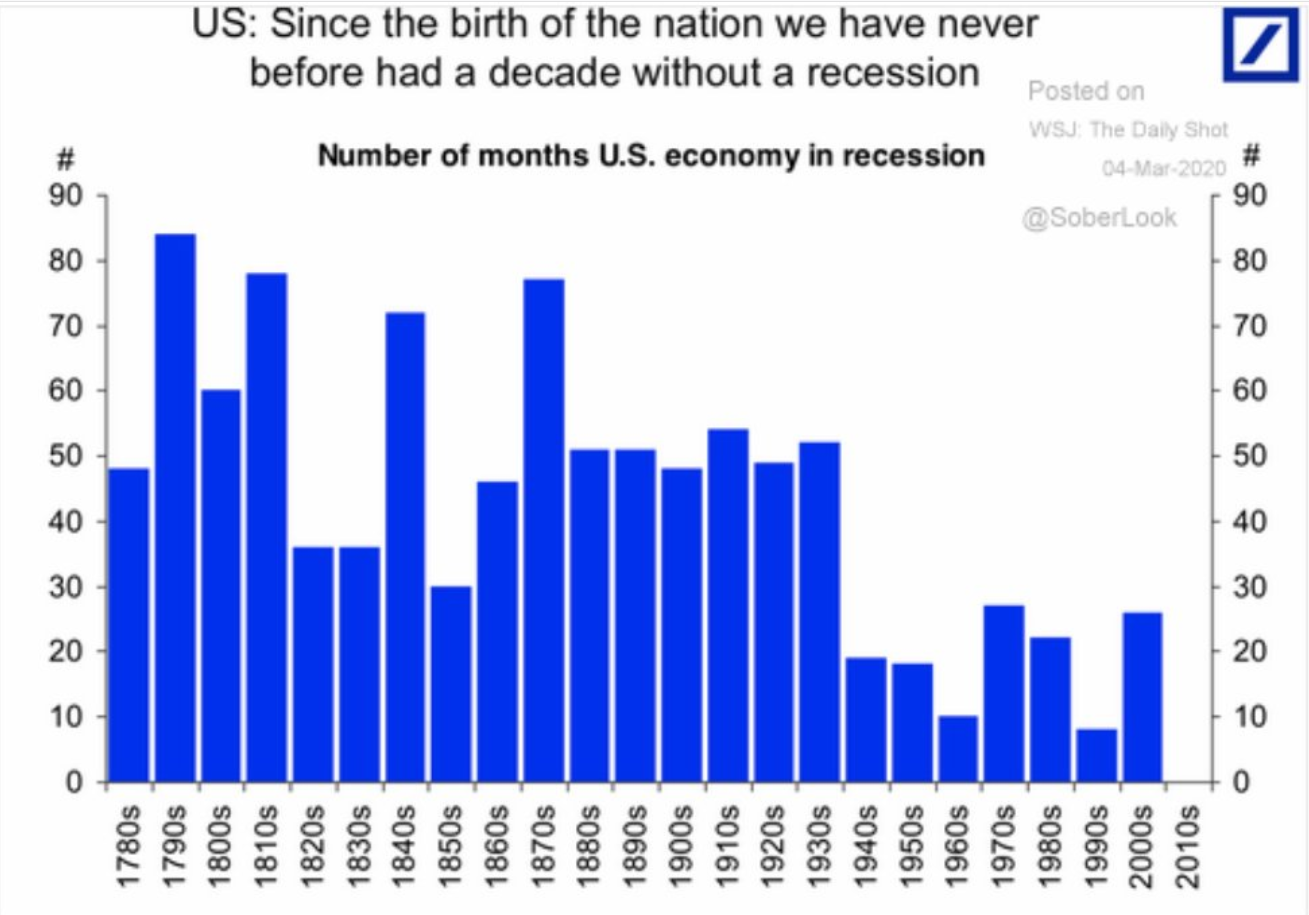
While the stock market is acting like a recession in the US is a foregone conclusion, we still need to appreciate how unusual the 2010’s were for the nation as it was the first decade without a recessionary period, ever.
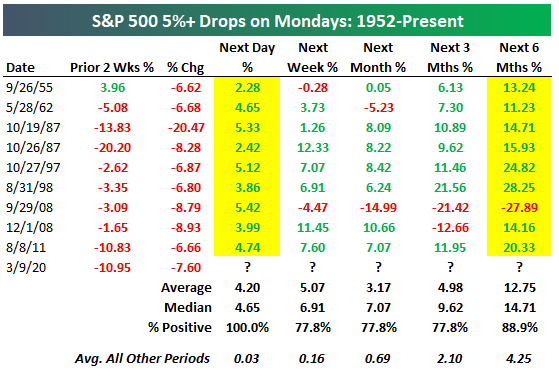
In closing: yesterday was very ugly for the stock markets, but unfortunately not without precedent. As the chart below shows, since 1952 there’s been 9 other times when the market dropped more than 5% on a Monday. In every other instance, stocks rebounded the next day. This by no means guarantees that today will bounce back; however, history is on our side as the chart below shows.
More importantly, look at the last column where it shows what stocks did in the 6 months following that big drop on a Monday: In all but one time period (during the Great Recession) stocks were appreciably higher. Curiously with that one outlier, the time period that started on 9/29/2008 where stocks were lower 6 months later as the chart shows in March of 2009….March 2009 marked the low for the stock market.
We have to remember why we invest in equities and realize that dealing with volatility is part of investing. There’s no guarantee what the future holds for stock returns, however as the chart below shows more often than not stocks are higher over the long term.
Source: Bespoke Investments
Derek Amey serves as Partner and Portfolio Manager at StrategicPoint Investment Advisors in Providence and East Greenwich. You can e-mail him at damey@strategicpoint.com.
The information contained in this post is not intended as investment, tax or legal advice. StrategicPoint Investment Advisors assumes no responsibility for any action or inaction resulting from the contents herein. Derek’s opinions and comments expressed on this site are his own and may not accurately reflect those of the firm. Third party content does not reflect the view of the firm and is not reviewed for completeness or accuracy. It is provided for ease of reference. Certain statements contained herein may be statements of future expectations and other forward-looking statements that are based on SPIA’s current views and assumptions and involve known and unknown risks and uncertainties that could cause actual results, performance or events to differ materially from those expressed or implied in such statements. In addition to statements which are forward-looking by reason of context, the words “may, will, should, expects, plans, intends, anticipates, believes, estimates, predicts, potential, or continue” and similar expressions identify forward-looking statements. Forward-looking statements necessarily involve risks and uncertainties, and undue reliance should not be placed on them. There can be no assurance that forward-looking statements will prove to be accurate, and actual results and future events could differ materially from those anticipated in such statements. SPIA assumes no obligation to update any forward-looking information contained herein.

